Using Lifecycle Assessments to Compare the Sustainability of Paper and Plastic Packaging Options
Sustainability
June 5, 2024
Sustainability
June 5, 2024
As a packaging material, paper’s strong sustainability profile and high recycling rate makes it attractive to end consumers. In a 2019 study, 55% of consumers felt that paper was the most sustainable packaging material, underscoring the positive perception of paper packaging in the market. While adopting paper packaging makes sense to deliver a better customer experience and support business outcomes, it is also critically important to examine how it performs across a range of sustainability metrics when compared to common plastic packaging alternatives. That’s why in 2023 Ranpak commissioned a peer-reviewed lifecycle assessment, studying the real sustainability performance of our products to better understand how they compare to their plastic counterparts.
In order to make informed decisions and improve their products, companies use lifecycle analysis to get a complete picture of how their solutions compare to others across key sustainability metrics. The results of the LCA are then prepared into a report, where different solutions can be examined and evaluated against other products.
When a LCA is ‘peer-reviewed,’ the methodology and the data results of the analysis have been reviewed by a panel of independent scientists who have verified the work and found it to be accurate. Therefore, while a non-peer-reviewed LCA may be helpful to provide a general sense of a product’s environmental footprint, non-peer reviewed LCA’s can subject to bias, since they generally are created internally by a business to validate a business objective. Accordingly, a peer-reviewed LCA is the highest standard assessment since impartial qualified third parties have weighed in on the findings.
Trayak, a sustainability platform provider and LCA company, prepared a cradle-to-grave lifecycle analysis of a selection of Ranpak’s void fill and wrapping products compared to common plastic protective packaging alternatives. A cradle-to-grave analysis includes examining all the steps in the process to make these products: from raw material extraction to component manufacturing, to average market transportation for materials processing, collection at end-of-life, and finally, the final end-of-life destination of the material, whether that is a recycling facility, incinerator, or a landfill.
This differs from a cradle-to-gate analysis that only counts the LCA factors leading up to a product leaving the “gate” of the manufacturing facility. This discounts transportation from the facility, consumer usage, and end-of-life disposal, referred to as the “grave.” When the end-of-life of a material isn’t considered, you wind up with only half the picture of how these materials impacted the environment, ignoring critical aspects of circularity including recycling potential.
The LCA results examined within this report were collected and peer reviewed, comparing paper, low-density polyethylene (LDPE), and high-density polyethylene (HDPE) void fill products and paper, LDPE, and polypropylene (PP) wrapping products for the regions of Europe and the USA.
What did the LCA uncover? The findings point to the specifics around how paper packaging is a superior sustainable material to plastic due to it being sourced from renewable resources and easier to recycle.
Ranpak developed our FillPak Trident™ converter to produce a paper void fill system with strong protective properties, while also maximizing material efficiency. The results of our LCA show how Trident Virgin 40# void fill compares with commonly used 10x20cm/8×4″ LDPE airbags, the kind that most consumers will have received in a typical e-commerce package. See the results below in Image 1.
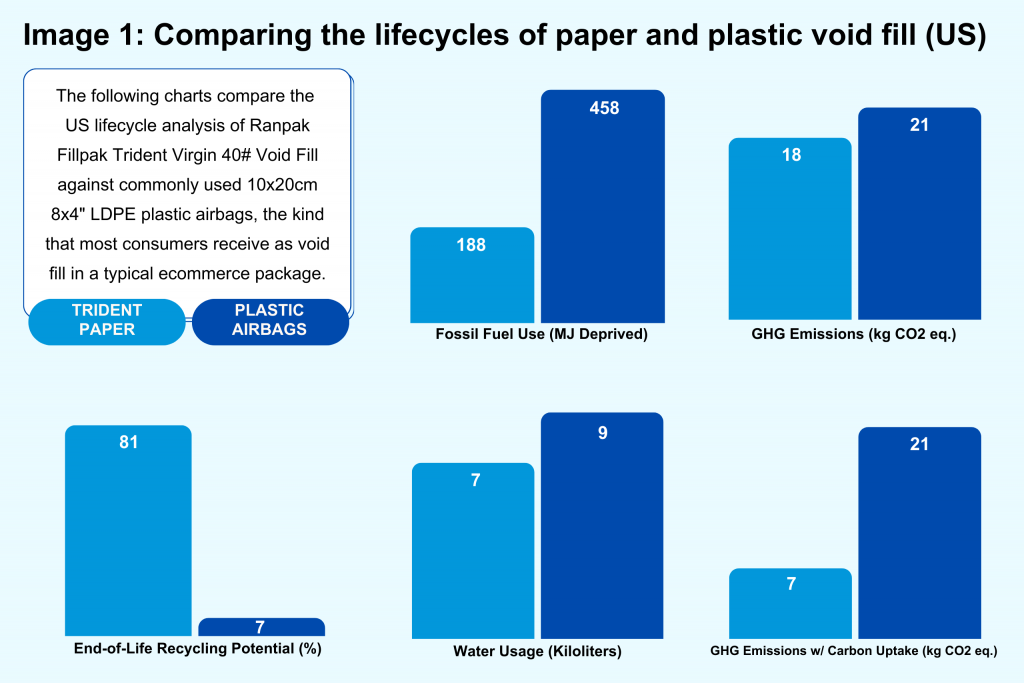
Fossil Fuel Use: Trident is the more sustainable option, as airbags used 143% more fossil fuels than paper Trident material.
GHG Emissions: Plastic is often touted as being a GHG-efficient material, despite the role that fossil fuels play in creating it; however, Trident shows that even within this point of relative strength, plastic does not outperform paper.
GHG Emissions with Carbon Uptake: Accounting for carbon uptake, the effect of carbon stored within the materials used in these products, Trident paper contributes 61% less GHG emissions, while emissions from plastic airbags are virtually unchanged.
Water: Trident again proves that paper can be just as environmentally efficient as common forms of plastic in areas where the material supposedly justifies its value, without contributing to the glut of plastic in landfills or shedding microplastics into our environment.
Recycling Potential: The recycling story is where paper materials truly shine compared to plastic airbags. Looking at percentages, the end-of-life recycling potential of FillPak Trident material is 80.74%. Energy reclamation (incineration) is 4.54%, while landfill is 14.72%. By contrast, the recycling potential for airbags is just 6.88%, while waste to energy is 18.25%. The rest is landfill, at 74.87%, showing the huge contrast between the circularity of paper products and the linear lifecycle of most plastics.
Geami paper offers an alternative to wrapping products in plastic bubble sheets that is made from 100% renewable resources. Comparing the LCA performance of Geami DC Only – V (80g/50#) with Bubble Wrapping – LDPE (small bubble), reveals that it compares favorably to bubbles across a number of sustainability metrics. See Image 2 for the full results.
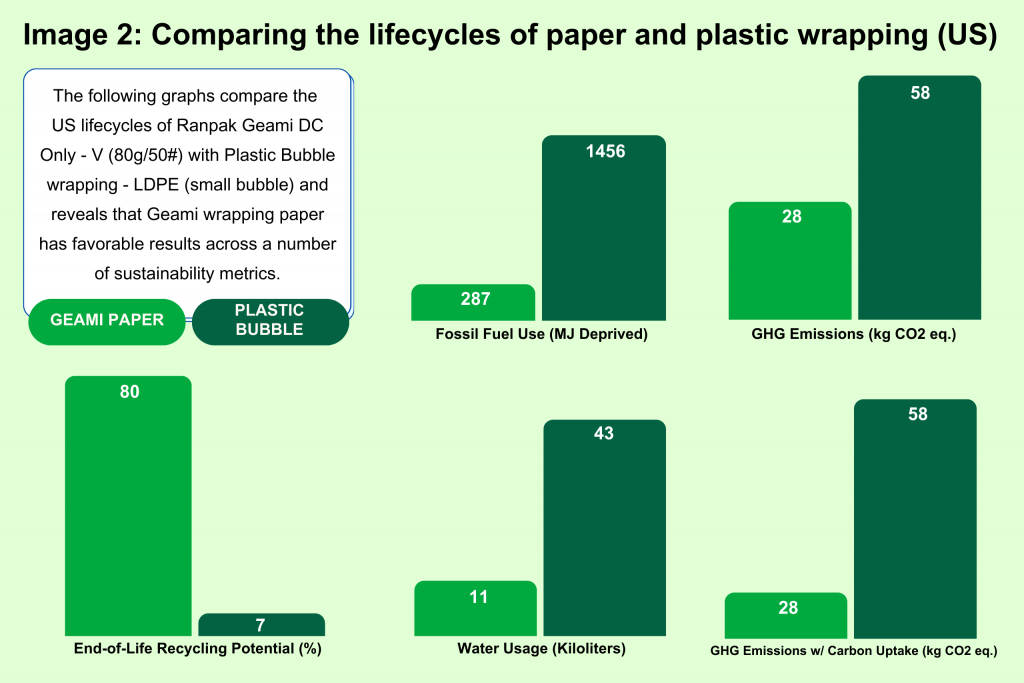
Fossil Fuel Use: Plastic bubble packaging is responsible for 408% more fossil fuel usage compared to the paper alternative presented by Geami.
GHG Emissions: Plastic bubbles produce 107% more GHG emissions through their cradle-to-grave lifecycle.
GHG Emissions with Carbon Uptake: When the sequestration effects of virgin wood are taken into account, Geami performs even better, accounting for almost a third less emissions than before taking carbon uptake into account. Meanwhile, bubble performs virtually the same.
Water: Bubble uses 289% more water, a dramatically larger use of this resource than the paper alternative.
Recycling Potential: Like other paper products, Geami boasts a high potential for recycling, with a 79.61% potential and a 15.65% landfill potential. Compared to bubble, these numbers are practically reversed. Bubble has only 7.18% recycling potential, with a 74.63% landfill potential. It’s also roughly four times more likely to be incinerated than Geami paper, making Geami the obvious choice from the standpoint of circularity.
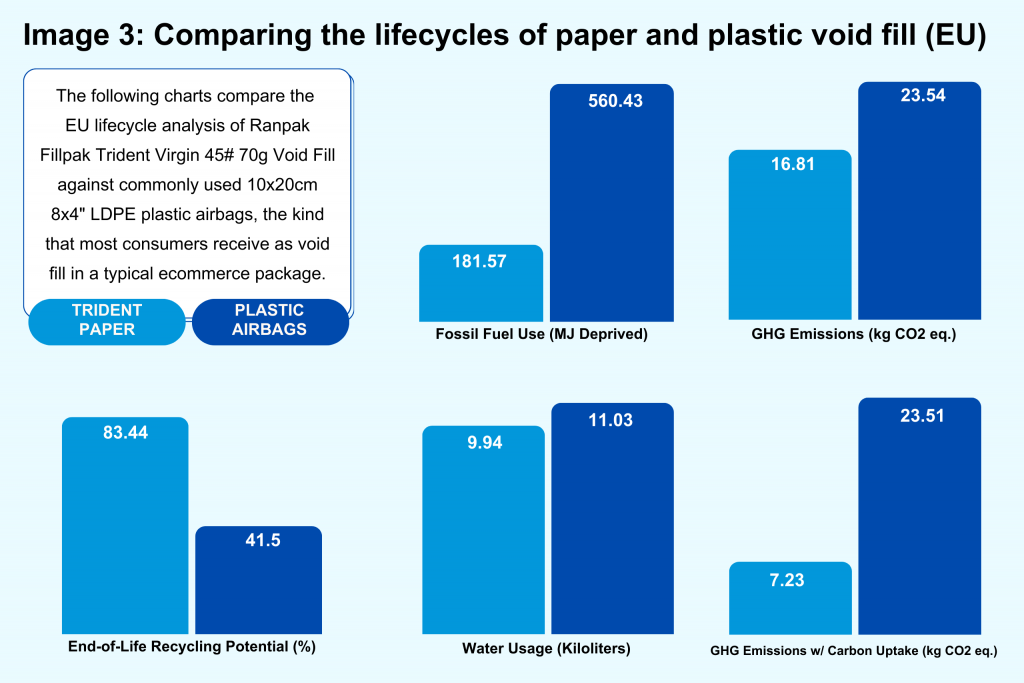
In Europe, plastic recycling is more common even for films such as LDPE that are rarely recycled in the US, but that is only one piece of the overall picture. It’s unfortunately common across both wrapping and void fill for these plastic products to be incinerated, accounting for around 30% of the end-of-life potential for most of the products that were examined.
The results of our EU LCA show how Trident Virgin 70g/45# void fill compares with commonly used 10x20cm/8×4″ LDPE airbags, the kind that most consumers will have received as void fill in a typical e-commerce package. See Image 3 below for the full results.
While Fillpak products across the board boast a stellar 83% recycling potential, LDPE films do much better in Europe with around 41% potential.
When examining the results of Geami DC Only – V (80g/50#) with Plastic Bubbles – LDPE (small bubble) in the EU, the recycling rate for both materials is also higher. See Image 4 below.
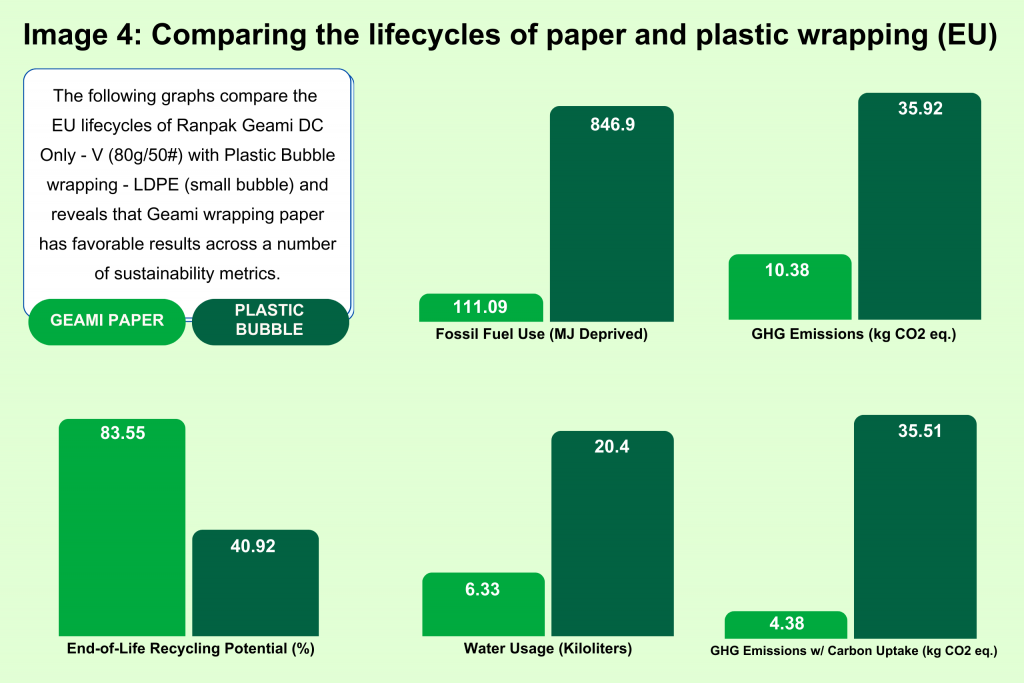
EU regulations for recycled content require that many EU plastic products now contain a percentage of recycled materials. However, there is a big difference between recycling PIR (post-industrial waste) and PCR (post-consumer waste). Post-industrial waste is typically leftover material from a manufacturing process—strong, essentially virgin material that can be used to make other products with a minimum amount of reprocessing. By contrast, post-consumer waste has been turned into products that have gone out to consumers and served through the full product lifecycle. While the Ranpak products we examined in this blog post were made of virgin materials, we offer a full range of products that incorporate the post-consumer wastepaper that you might recycle in your own home or curbside recycling bin.
Atlanta | March 28 – 31
Visit us at the
Caja Robotics booth: #C3789

You are now leaving the Ranpak website. The website you will be entering is not owned or operated by Ranpak and/or its subsidiaries. The content, products and information contained on third party websites are not owned or controlled by Ranpak and/or any of its subsidiaries. Therefore, Ranpak makes no representations about, does not endorse or adopt, and is not responsible or liable for damages relating to the third party, its products or services, its website, its privacy policies or practices, or the content of the third party website.